|
||
|
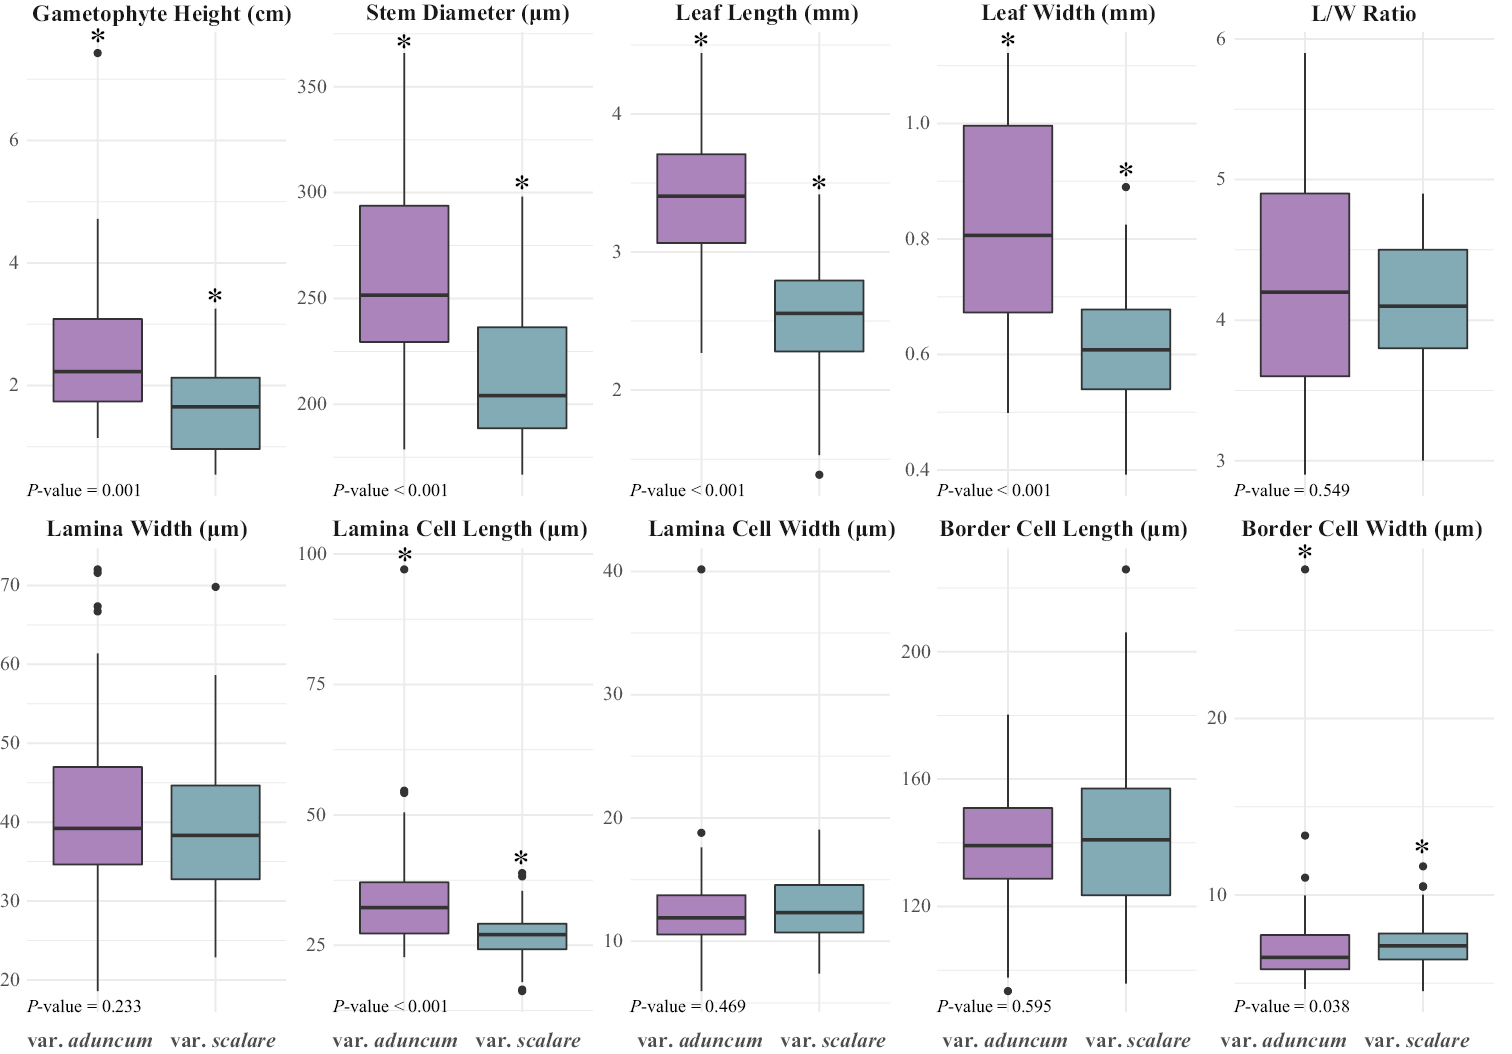
Boxplot showing variation on the ten quantitative characters in the two varieties of Leucobryum aduncum. The boxes represent the data from the 25th to 75th percentiles, with the median at the line in the box. The black dots outside the bar represent the “outlier” data points. All P-values are from Wilcoxon’s test between the two varieties, and the two varieties are considered significantly different in that trait at P-value ≤ 0.05. |