|
||
|
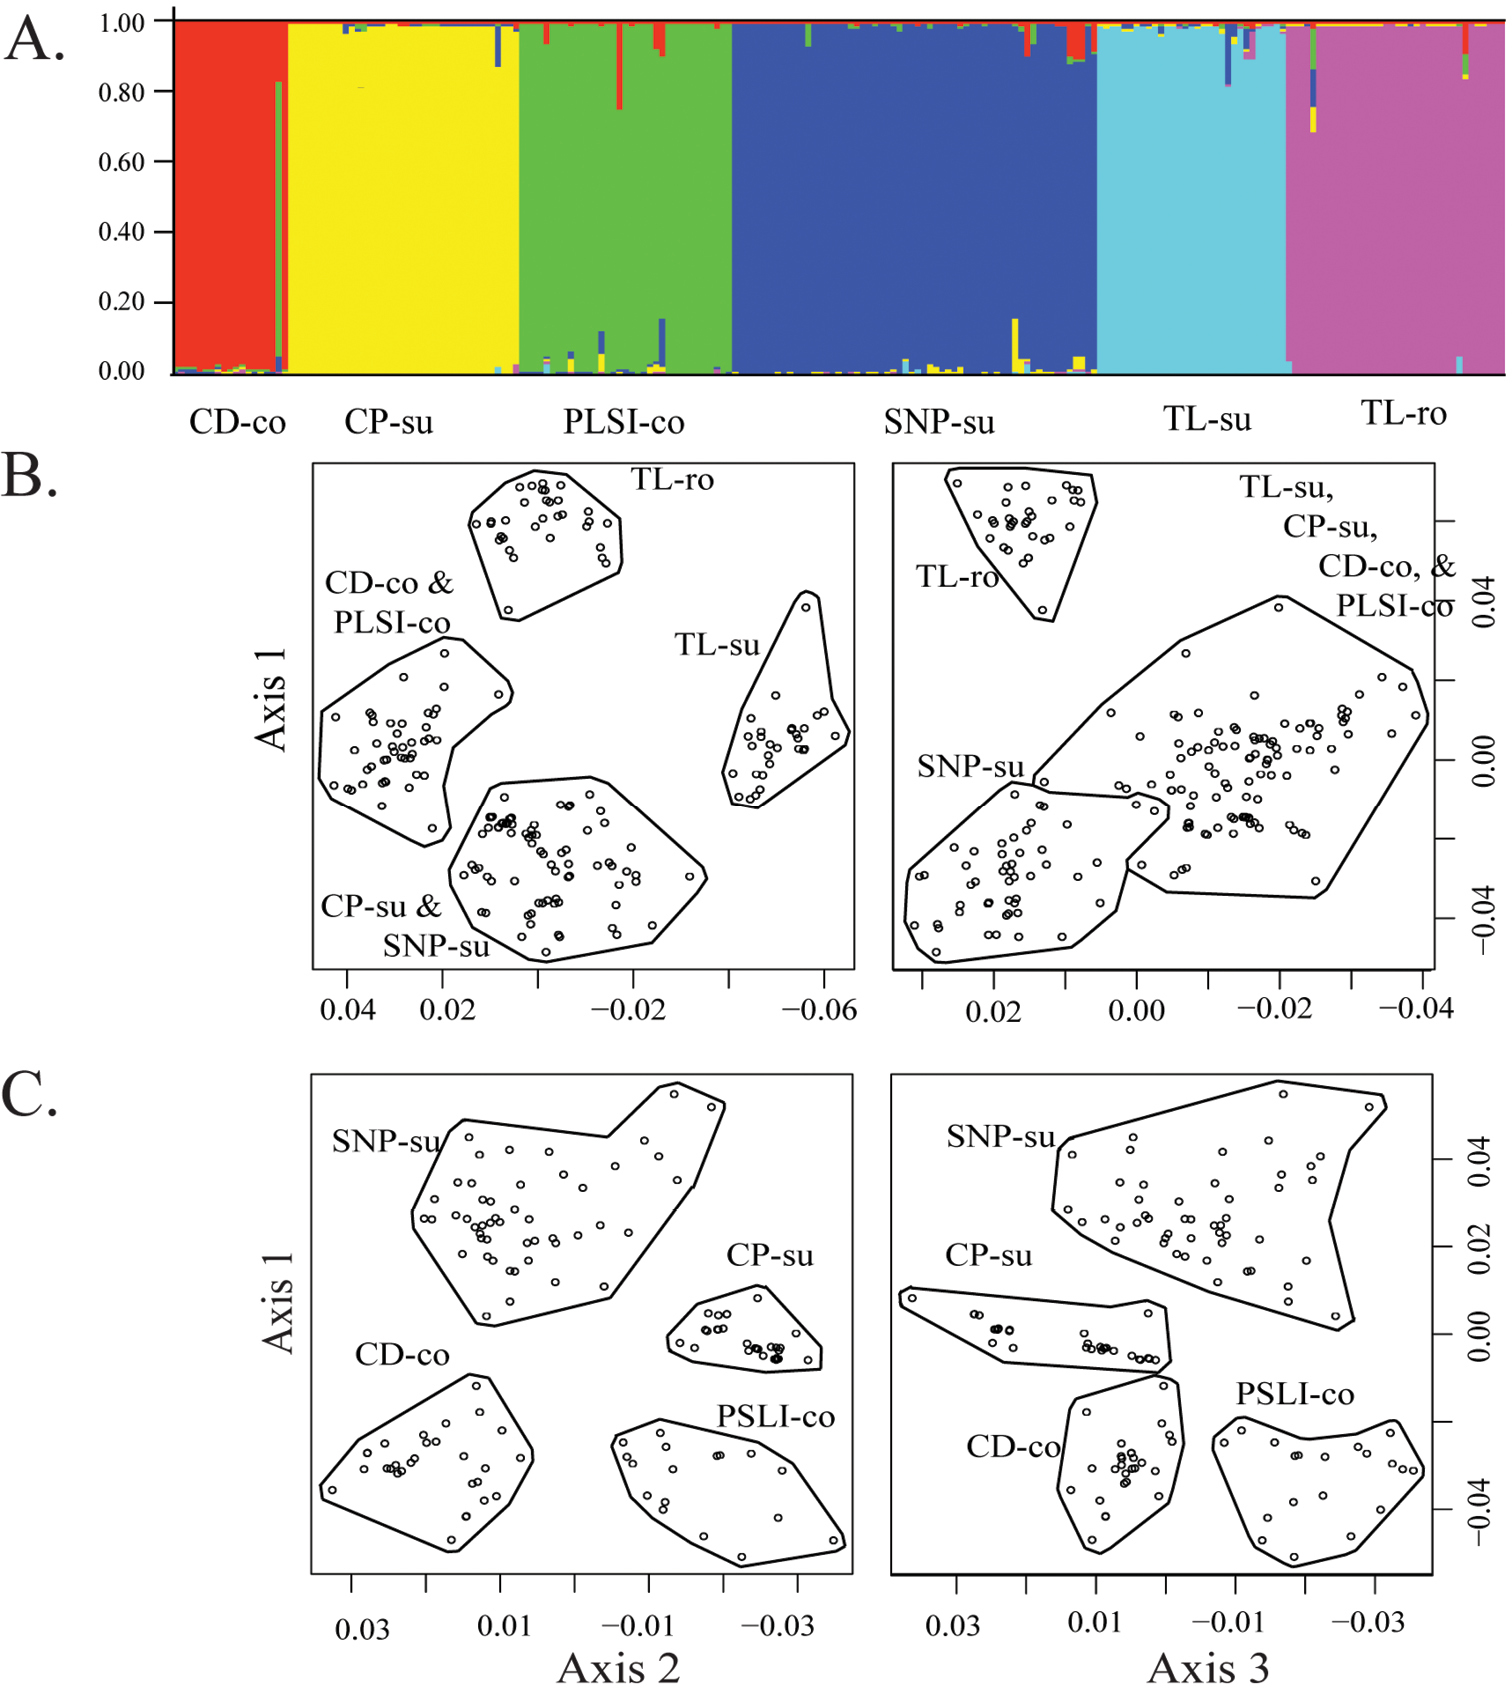
Results from Analysis 2 (which excluded TL-co). A STRUCTURE bar plot with K = 6 BMDS microsatellite plot of first three axes at K = 6 as found with the gap statistic CMDS plot with TL-su and TL-ro, the most divergent clusters, excluded to demonstrate coherence of the remaining four clusters (gap statistic K = 4). |