|
||
|
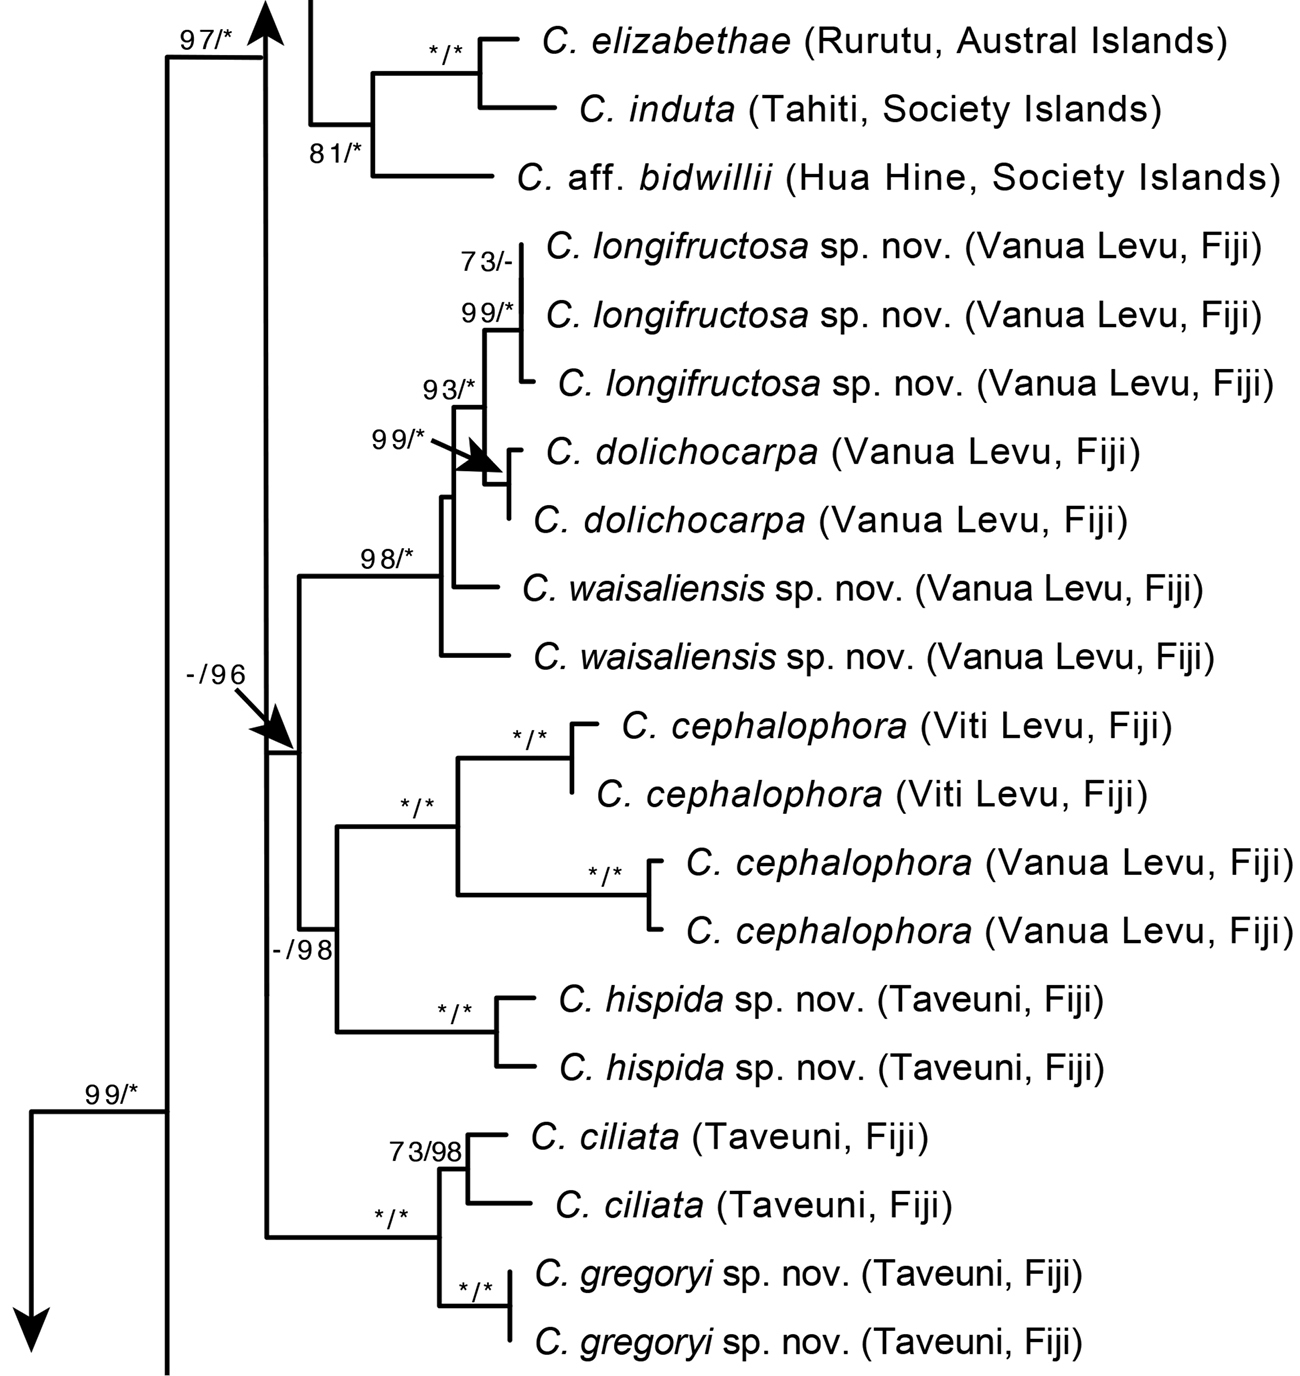
A portion of the Maximum Likelihood phylogram from Johnson et al. (2017) based on three nuclear (ITS, ETS, Cyrt1) and two chloroplast (psbA-trnH, rpl32-trnL) loci. Support values shown for each branch are bootstrap and posterior probabilities when ≥ 50% and ≥ 0.50, respectively. An asterisk indicates 100% BS or 1.0 PP; a dash indicates that the branch was not supported. |