- ContentsContents
- Article InfoArticle Info
- CiteCite
- MetricsMetrics
- CommentComment
- RelatedRelated
- FigsFigs
- TabsTabs
- TaxaTaxa
- RefsRefs
- CitedCited
- NanopubsNanopubs
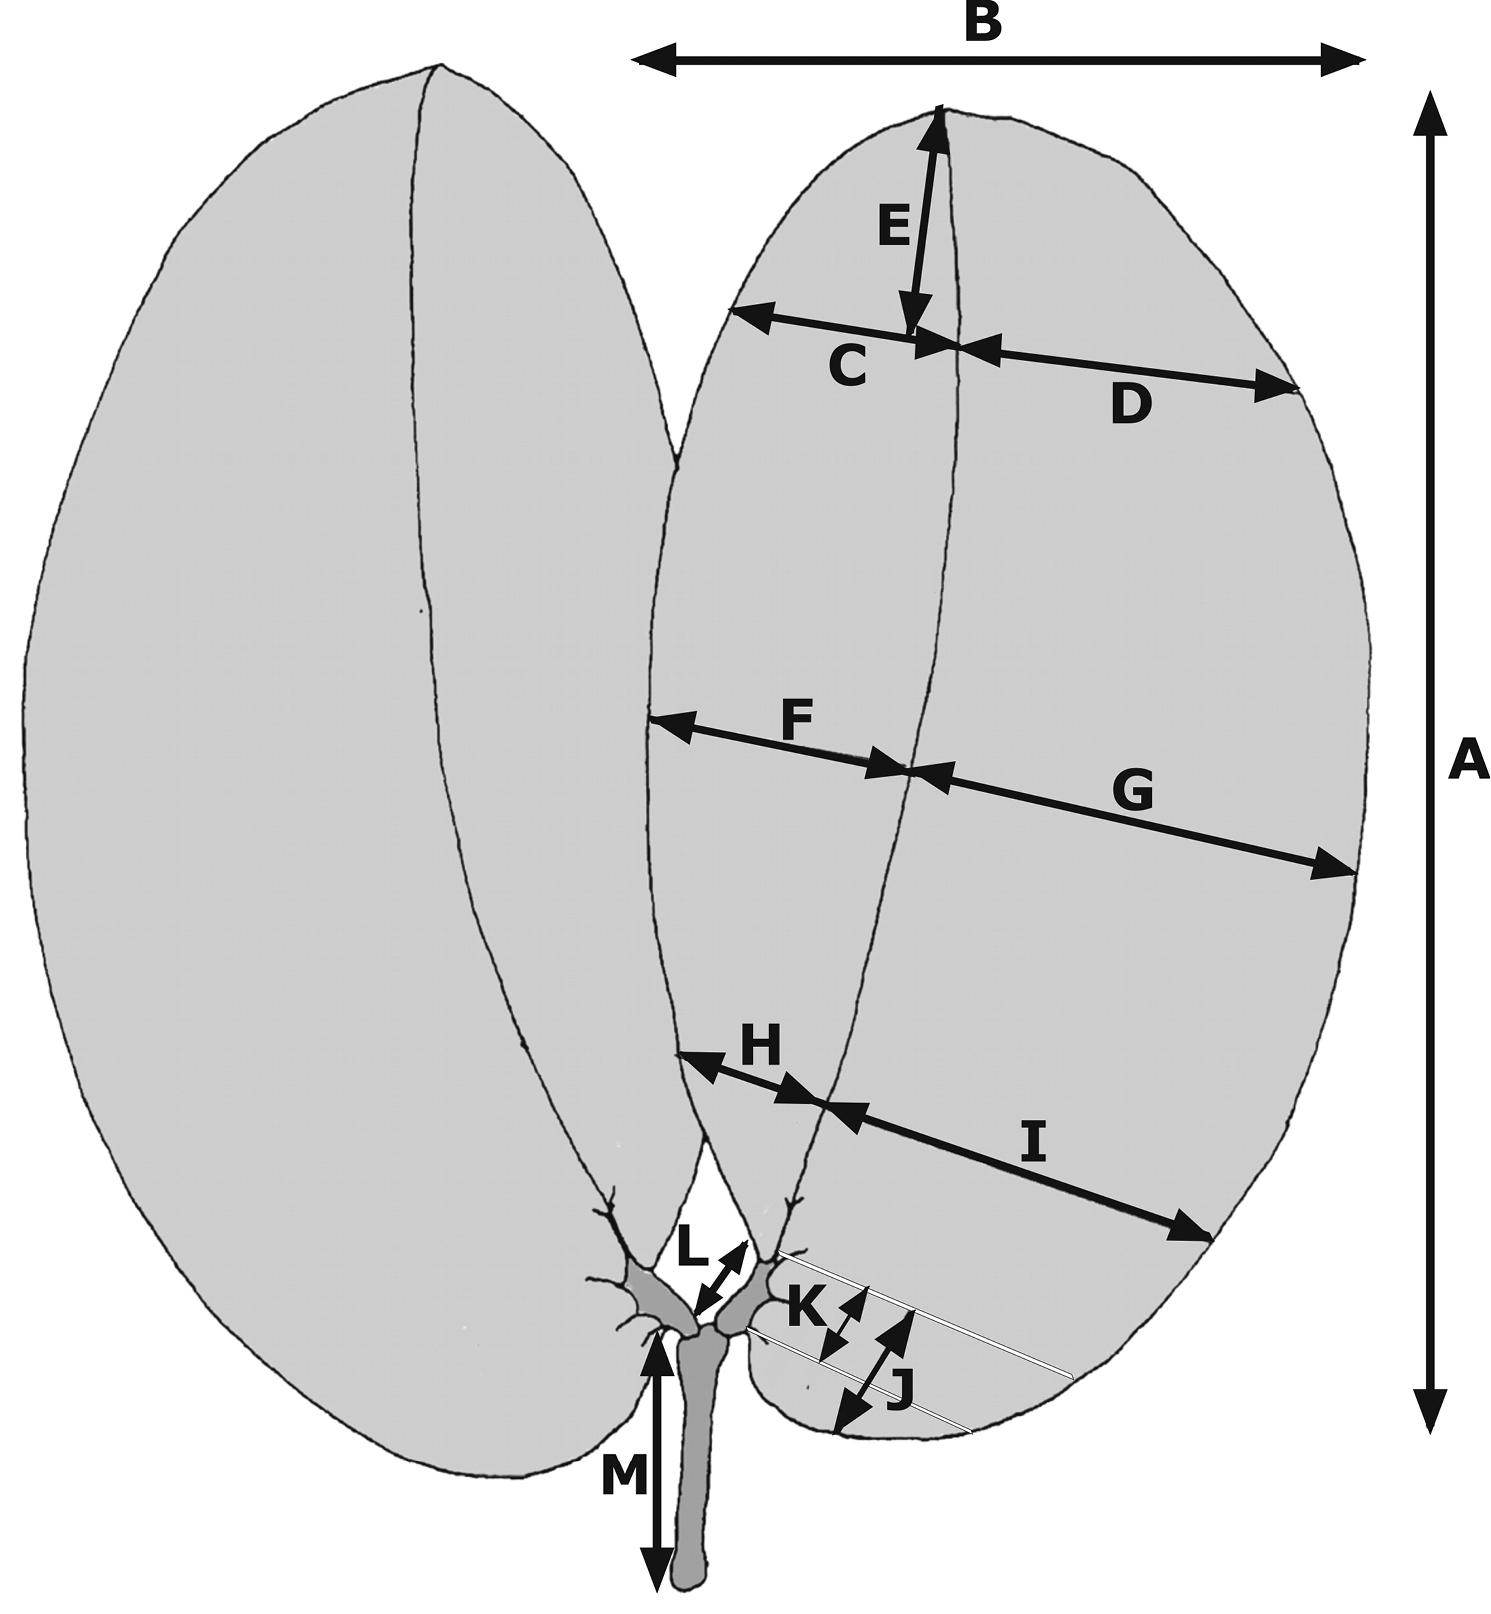
Quantitative leaf characters of specimens of the Hymenaea courbaril complex. Letters refer to the measurements described in Table 1.
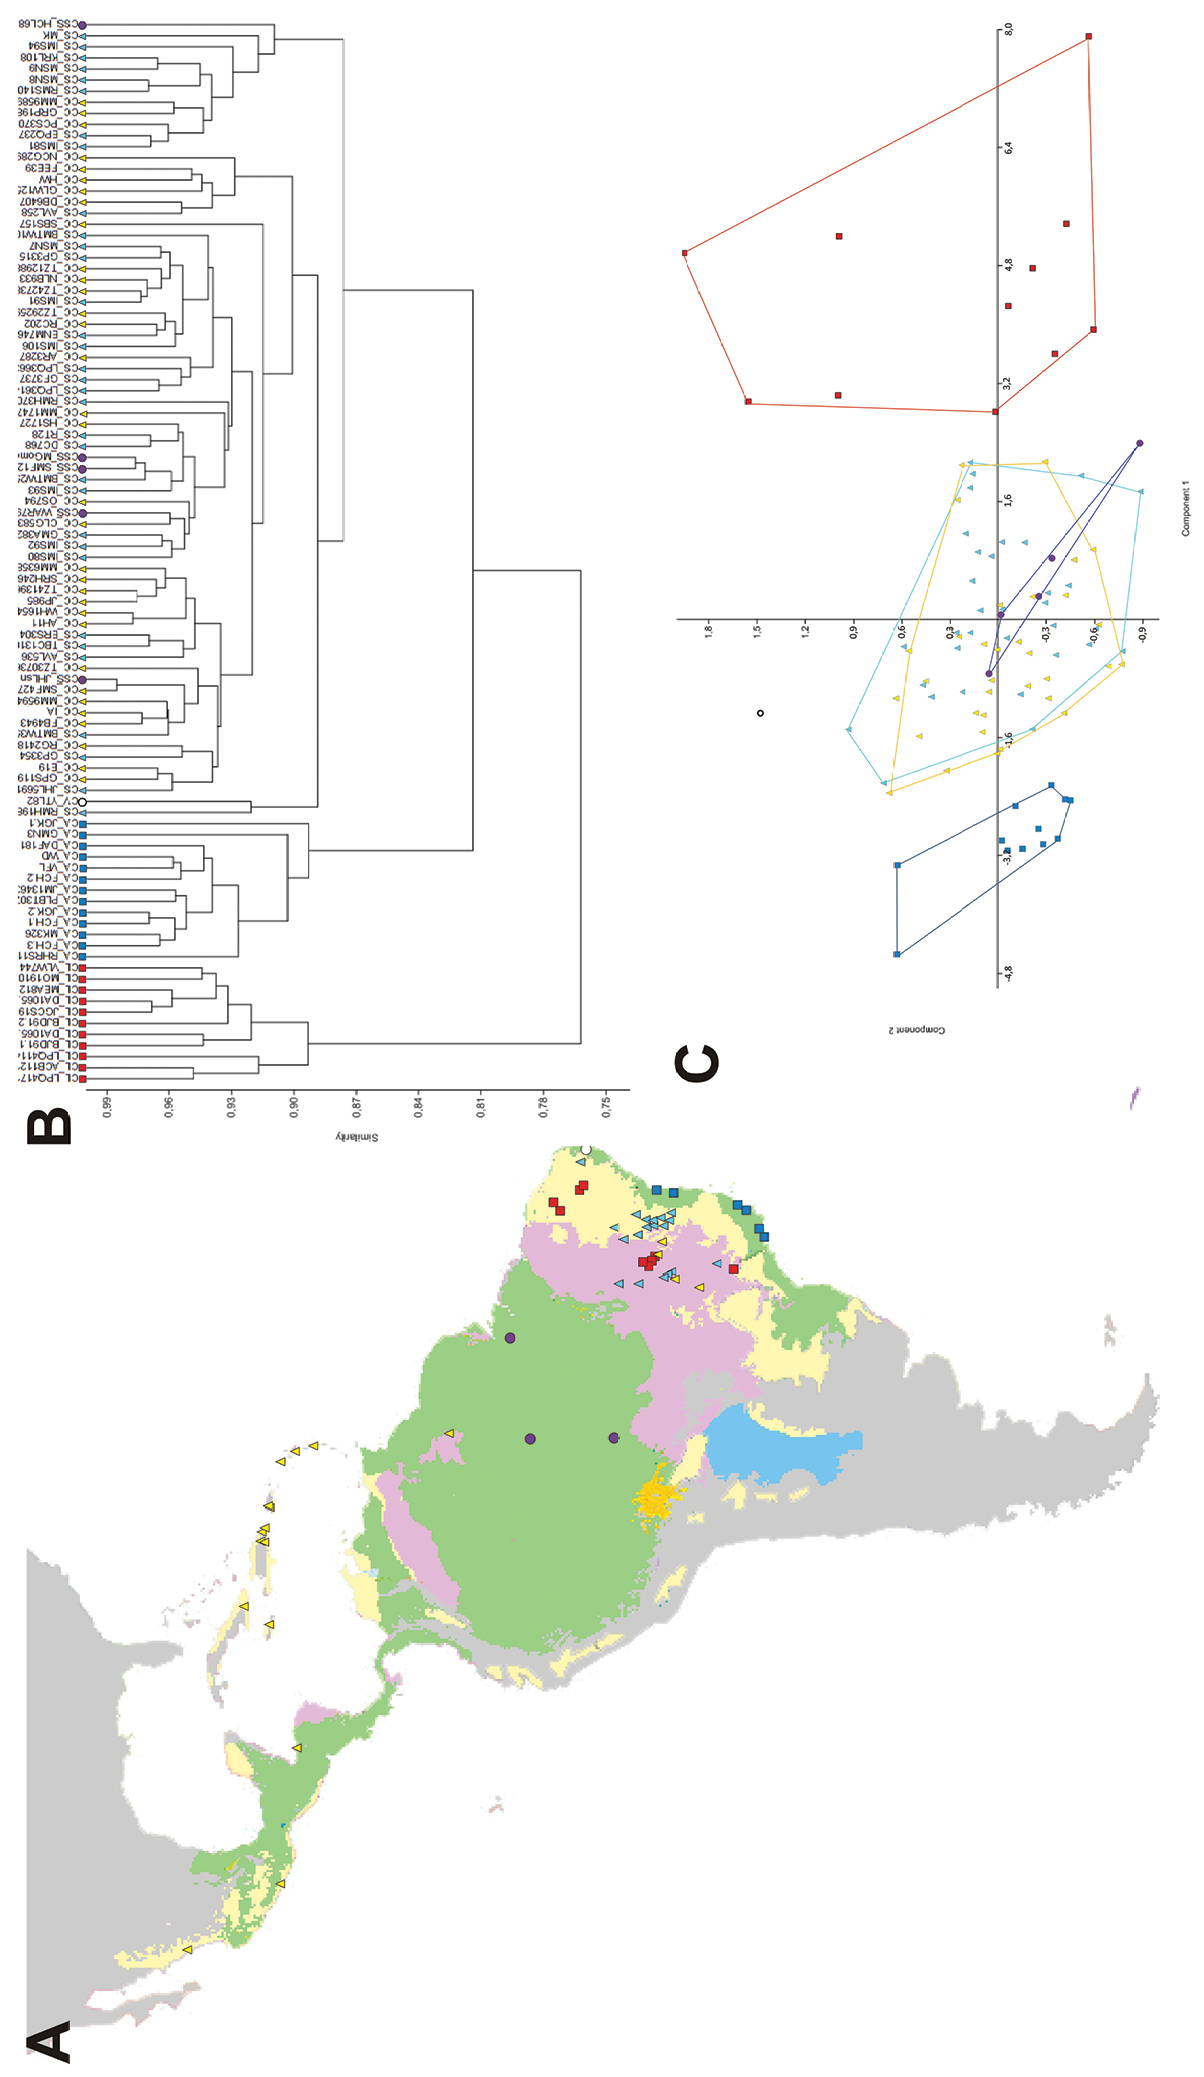
A Distribution of the Hymenaea courbaril complex in the Neotropics. The major biomes where this complex occurs are shown in color: wet forests (green), seasonally dry forests and woodlands (yellow), and savannas (purple). The varieties of Hymenaea courbaril recognized by Lee and Langenheim (1975) are represented by different symbols: var. altissima (blue squares), var. coubaril (yellow triangles), var. longifolia (red squares), var. stilbocarpa (blue triangles), var. subsessilis (purple circles), and var. villosa (white circles) B UPGMA analysis of the Hymenaea courbaril complex based on 14 quantitative leaf measures (see Figure 1 and Table 1 for measurement details and Bray-Curtis distances). Varieties are represented by the same symbols used for the map C Scatter diagram showing the first two axes of the PCA using the same data matrix as the UPGMA analysis. Ellipses represent the varieties as recognized by Lee and Langenheim (1975), and they are represented by the same symbols used for the map.
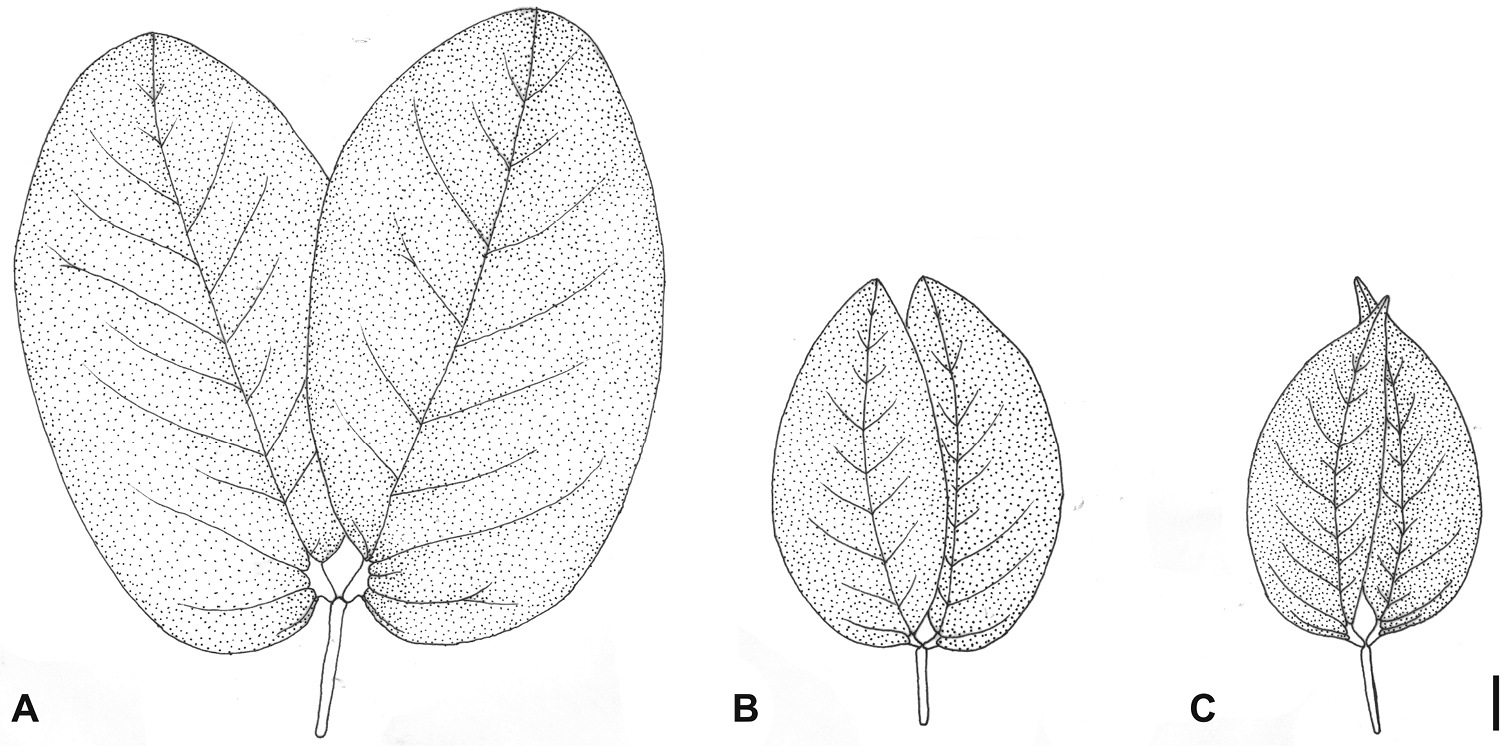
Leaf morphology of the species recognized in the Hymenaea courbaril complex: A Hymenaea longifolia B Hymenaea courbaril C Hymenaea altissima. Scale bar = 1 cm.