|
||
|
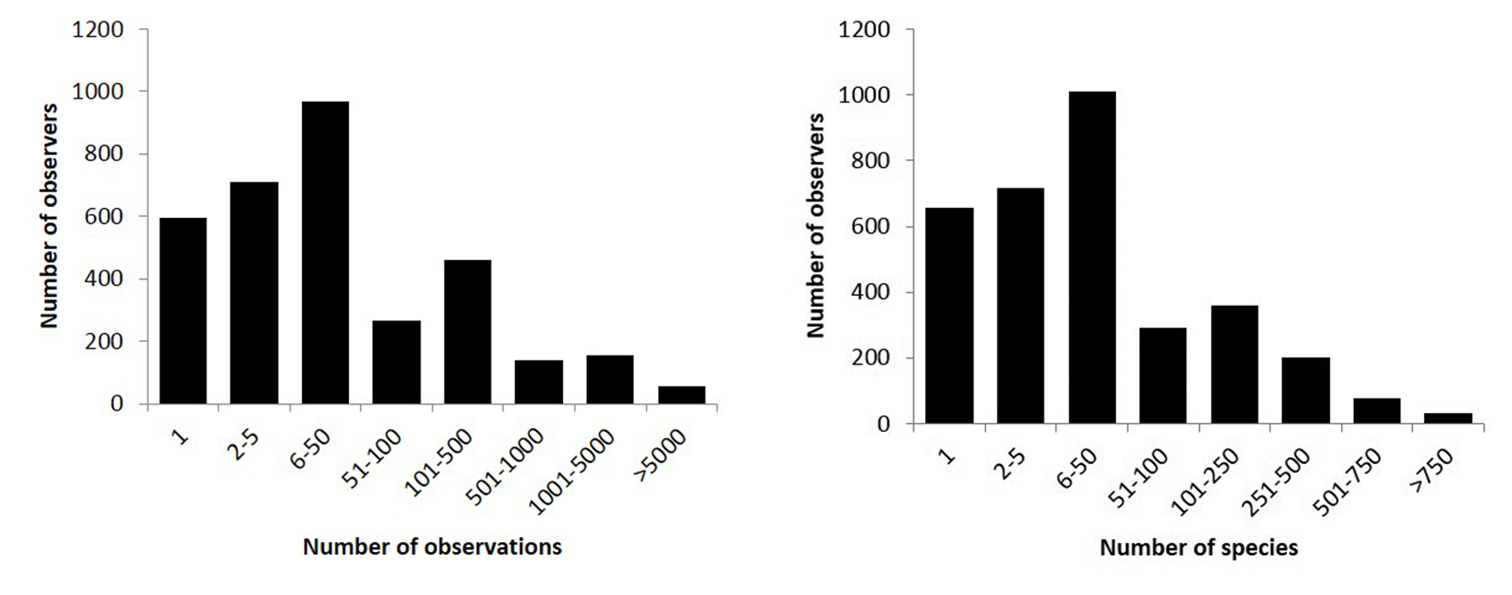
Frequency distribution of observers per number of observations (left) or species (right). Note the difference between the x-axis in the left and right y-axis. |
|
||||||||
| Part of: Steeman R, Vanreusel W, Barendse R, Verloove F, Wysmantel N, Van den Bussche W, Gyselinck T, Hendrickx P, Zwaenepoel A, Van Vooren P, Jacobs S, Desmet P, Gielen K, Herremans M, Swinnen K, all plant working groups and plant observers (2017) Waarnemingen.be – Plant occurrences in Flanders and the Brussels Capital Region, Belgium. PhytoKeys 85: 1-10. https://doi.org/10.3897/phytokeys.85.14925 |