|
||
|
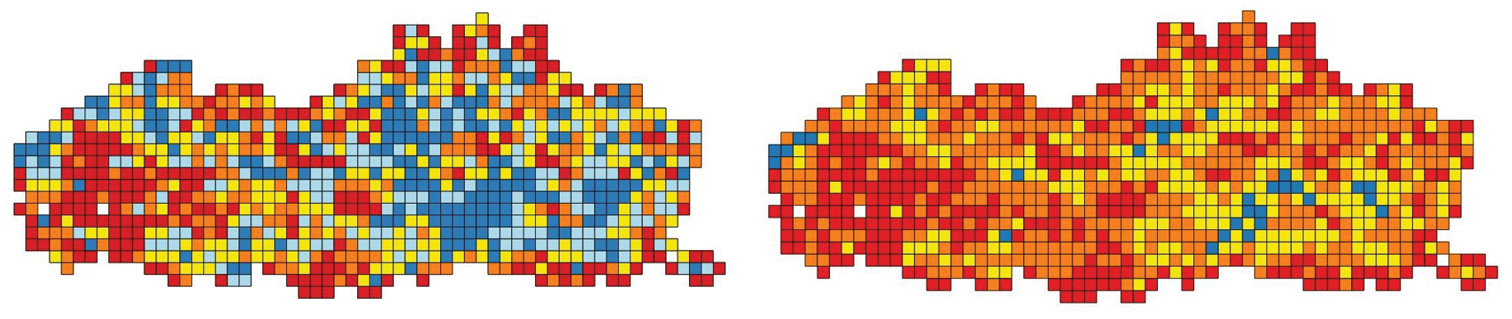
Left: the number of plant observations per IFBL grid cell. Red (1–200), orange (201–500), yellow (501–1000), light blue (1001–2000) and dark blue (2001–14000). Right: the number of plant species (subspecies, varieties, forms, hybrids and multispecies not included) per IFBL grid cell. Red (1–150), orange (151–300), yellow (301–450) and blue (451–600). The two white IFBL grid cells in the west of Flanders are locations without plant observations. |