|
||
|
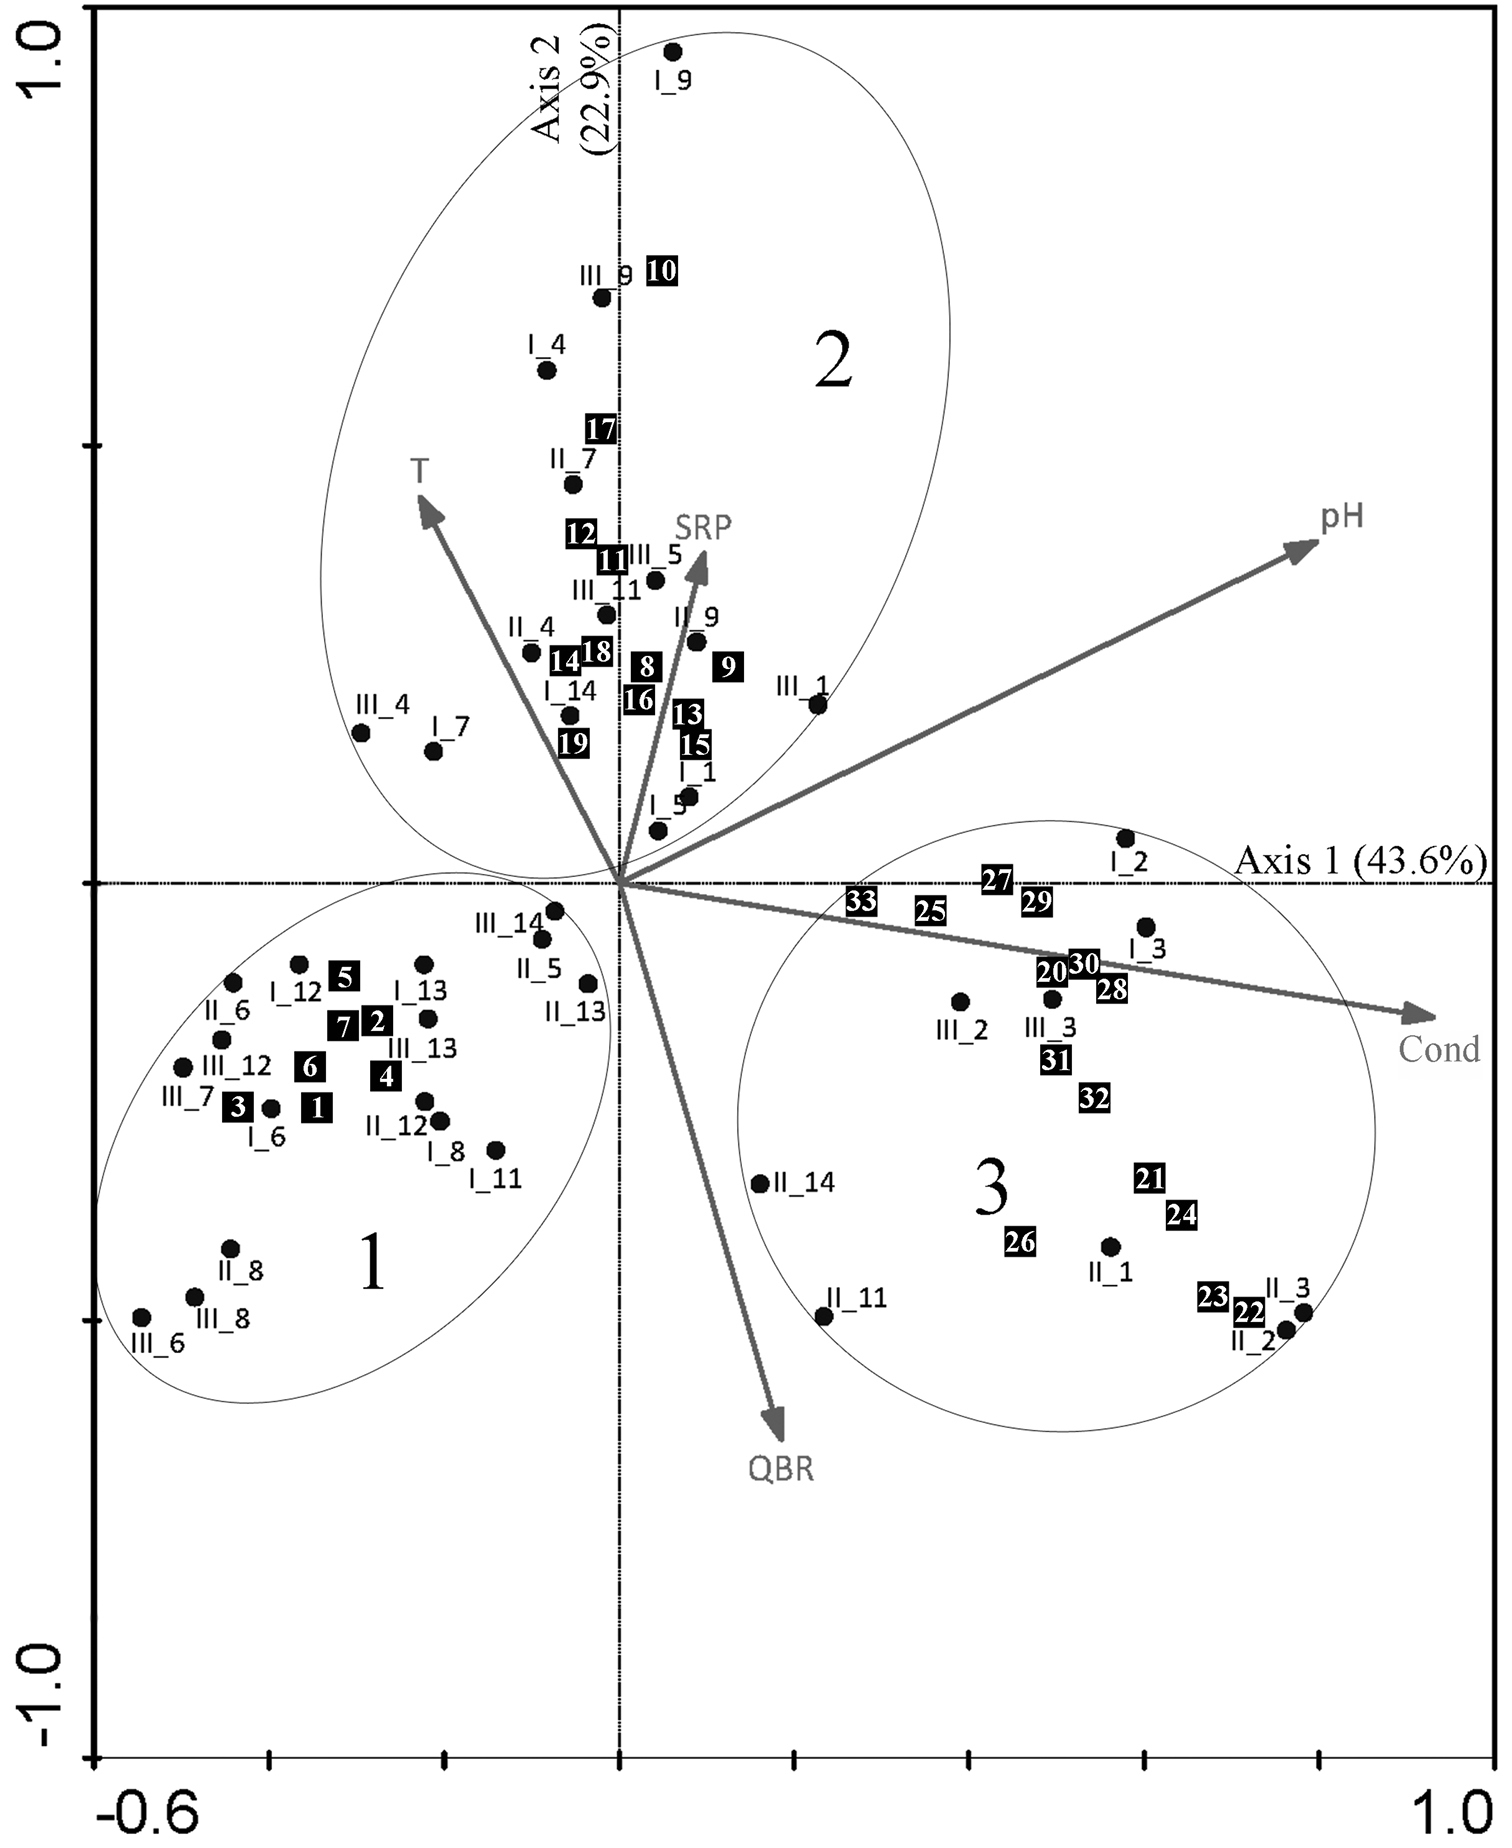
Canonical Correspondence Analysis (CCA) ordination plot. Distribution of sampling sites based on diatom abundance data in relation to statistically significant environmental variables. Three groups of samples are depicted within ovals. For visualization purposes, only species with significant IndVals (p< 0.05) are included in the plot. Black squares correspond to species; numbers within the black squares refer to taxa names in Table 4. Sampling sites are codified as follows: a Roman numeral indicating the sampling campaign (I, II and III), followed by an underscore symbol and an Arabic numeral indicating the sampling site (sites 1 to 14). For abbreviations and units of the physical and chemical parameters refer to Table 2. |