|
||
|
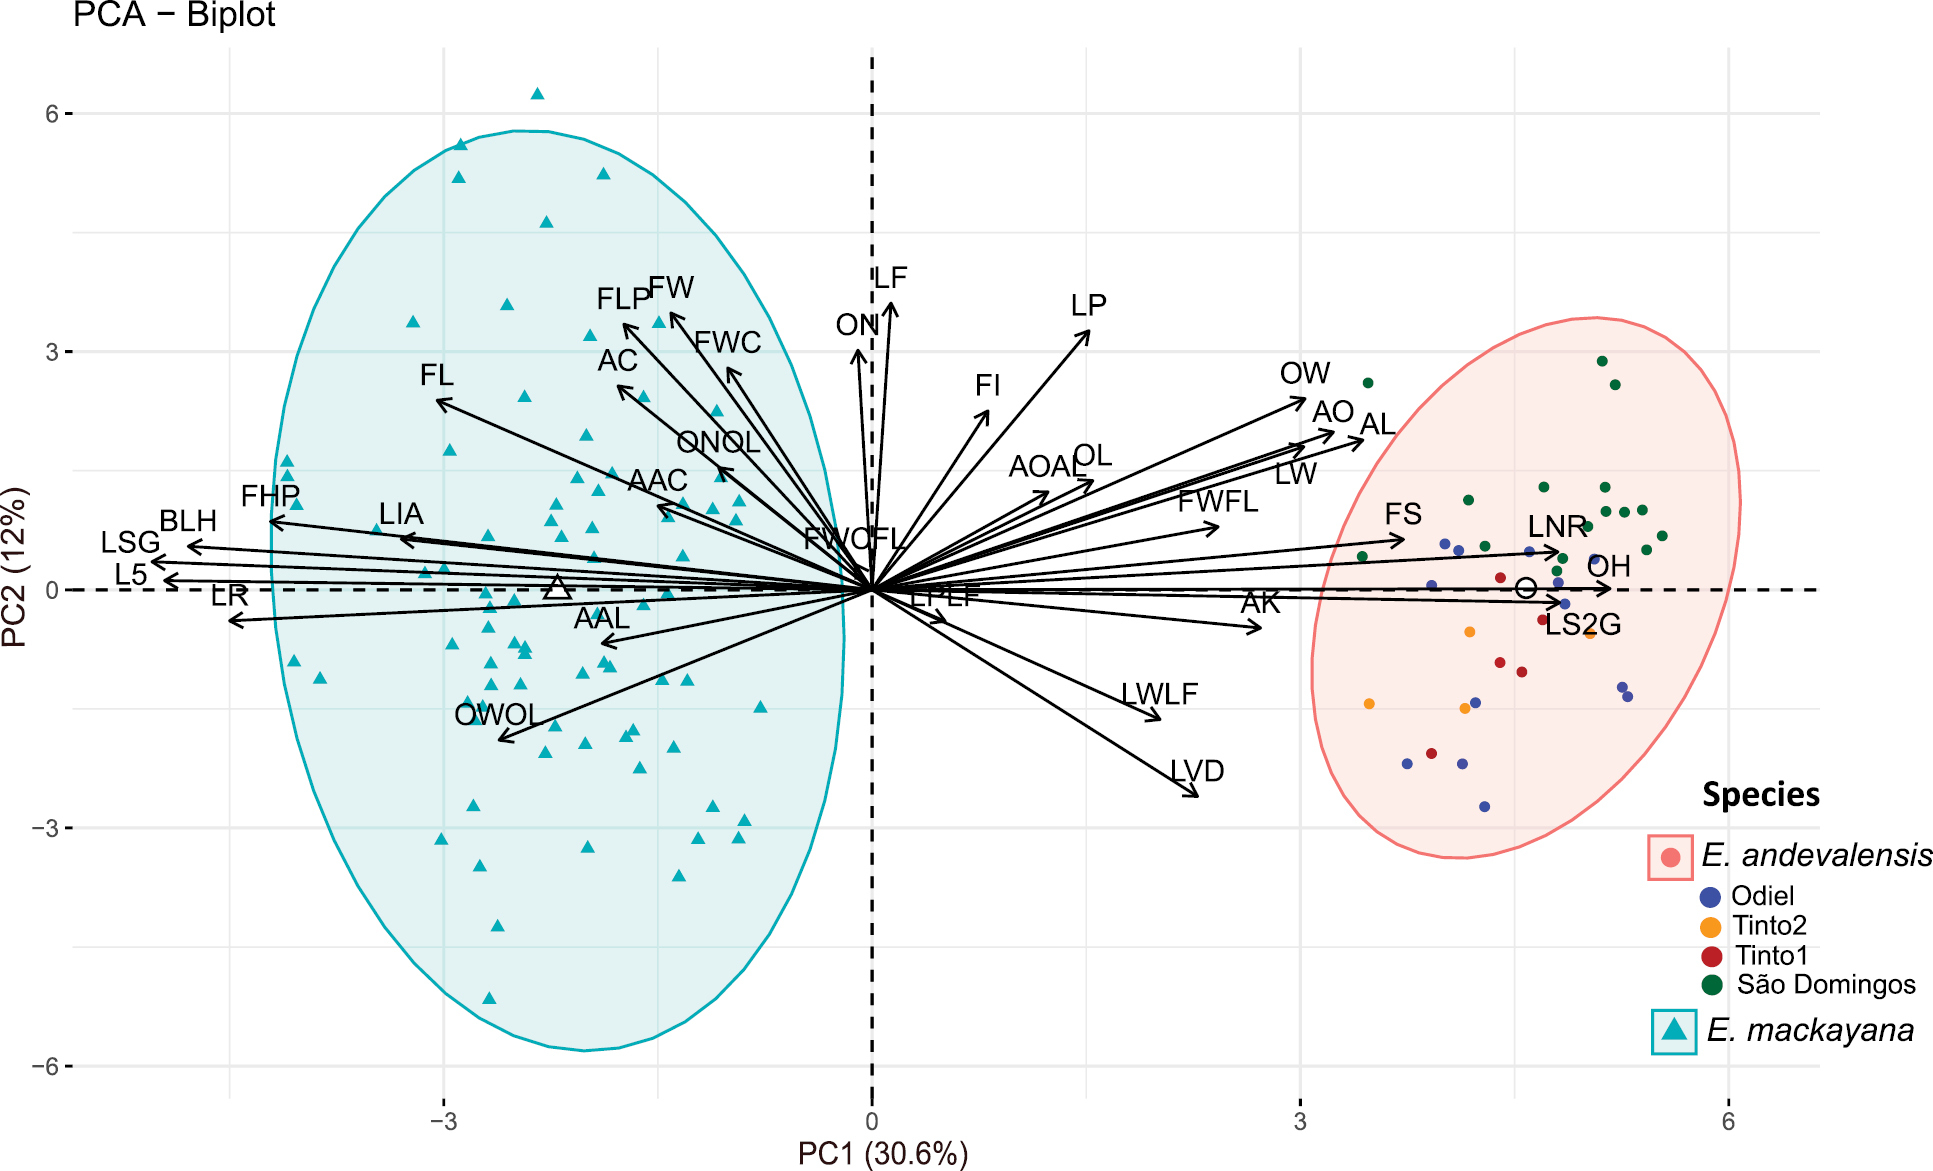
Biplot showing the first two principal components. Each ellipse represents the area that would encompass 95% of individuals assuming populations follow a normal distribution. White dots and triangles represent E. andevalensis and E. mackayana centroids respectively. Erica andevalensis populations are represented in different colors: Green (São Domingos), blue (Odiel), brown (Tinto1), yellow (Tinto2). Trait acronyms as in Fig. 3 and Suppl. material 1: table S2. |