|
||
|
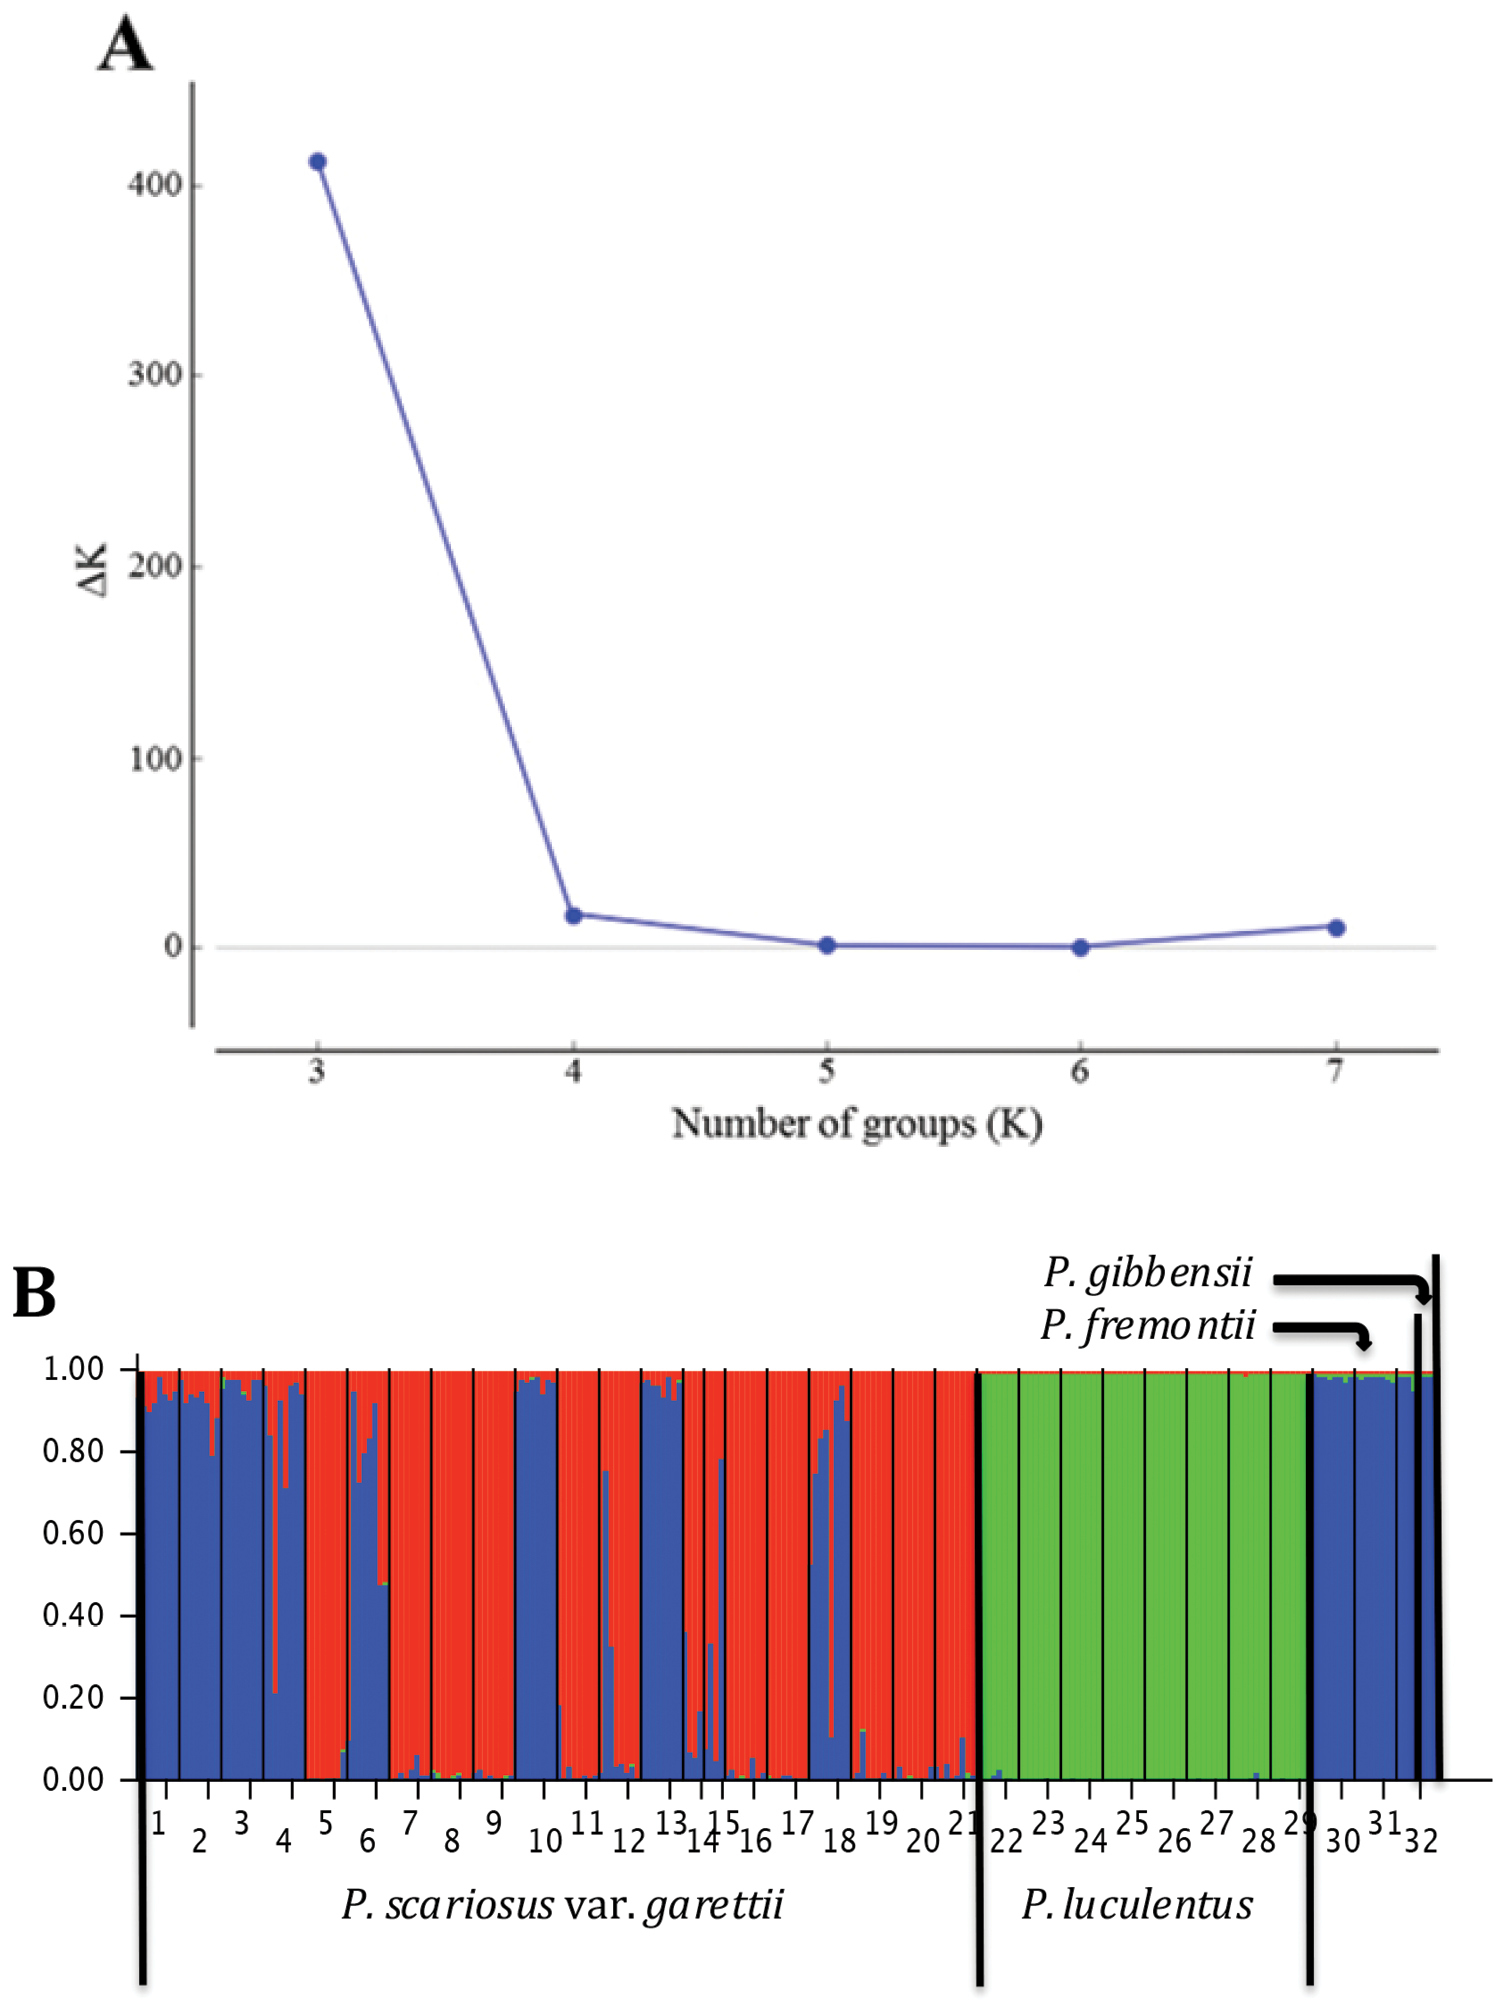
A Plot of the second order difference (ΔK) of K values (2–8) tested in STRUCTURE analysis identifying K = 3 as the optimal number of populations based on the accessions of Penstemon luculentus, P. fremontii, P. scariosus var. garrettii, and P. gibbensii tested. As the K values tested were from 2 to 8, the first difference in K values (ΔK) starts at K = 3 B Bar plot of inferred ancestry coefficients from STRUCTURE analysis results for with K = 3 using 248 samples from 32 accessions. Each number on the x axis represents the accessions ID# in Table 1. |